
Locating wrecks with geophysical methods
Geophysics deals primarily with those areas of the earth that are not accessible for direct measurements, such as the ocean and the subsurface. In the North Sea Wrecks project, we also use geophysical remote sensing methods to locate wrecks and munitions and to image the seafloor and the shallow subsurface. This helps us address the state of the investigated wrecks and assess the sediment dynamics around the wrecks.On the North Sea Wrecks research cruises, we generally use three so-called seismo-acoustic instruments: a multibeam echosounder, a side scan sonar and a sub-bottom profiler.
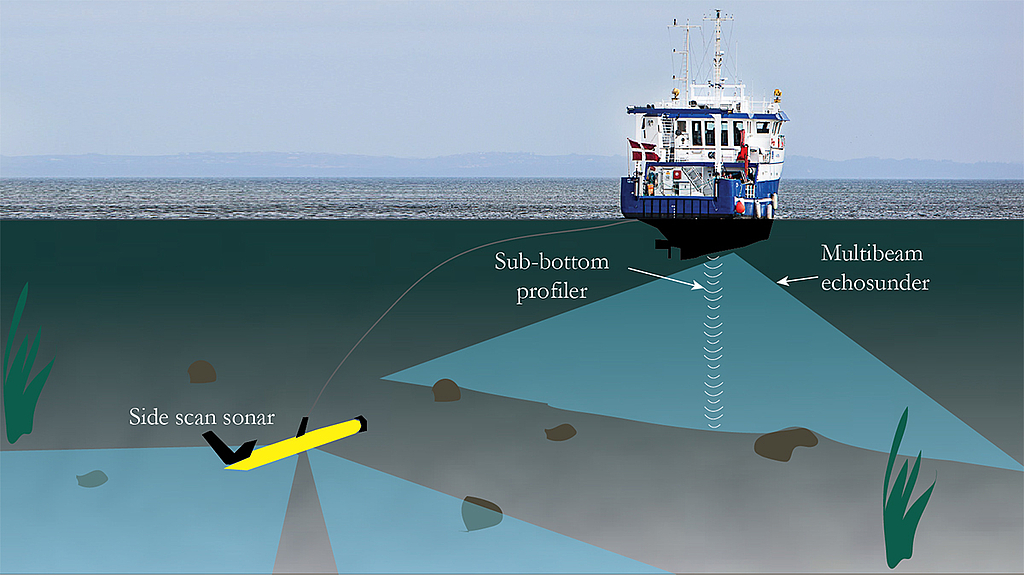
Acquisition of marine geophysical data during the North Sea Wreck cruises / The multibeam echosounder and the sub-bottom profiler instruments are mounted in the hull of the ship, while the side scan sonar is dragged through the water behind the ship © Katrine Juul Andresen, Aarhus University
All instruments work by emitting electrically produced high-frequency sound waves that travel through the water and become reflected at the wrecks, the seafloor and layer interfaces in the subsurface.
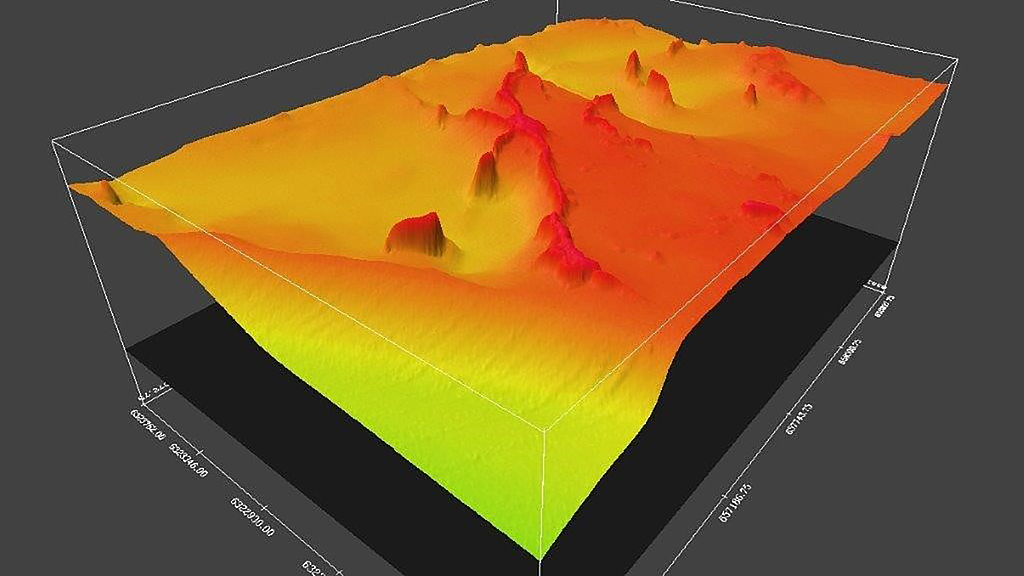
Multibeam echousounder data from the Baltic Sea showing a stone reef © Aarhus University.
The multibeam echosounder scans the seafloor and is used to produce a map of the seafloor topography – the bathymetry. The instrument is typically mounted on the hull of the
ship and works by emitting a ping which upon return is divided in up to 1024 sound beams that together form a swath of sound. By recording the time it takes for the beams to travel back to the ship, we can calculate the water depth if we know the true speed of sound in seawater (approximately 1500 m/s) and construct detailed maps of the seafloor and the wrecks.
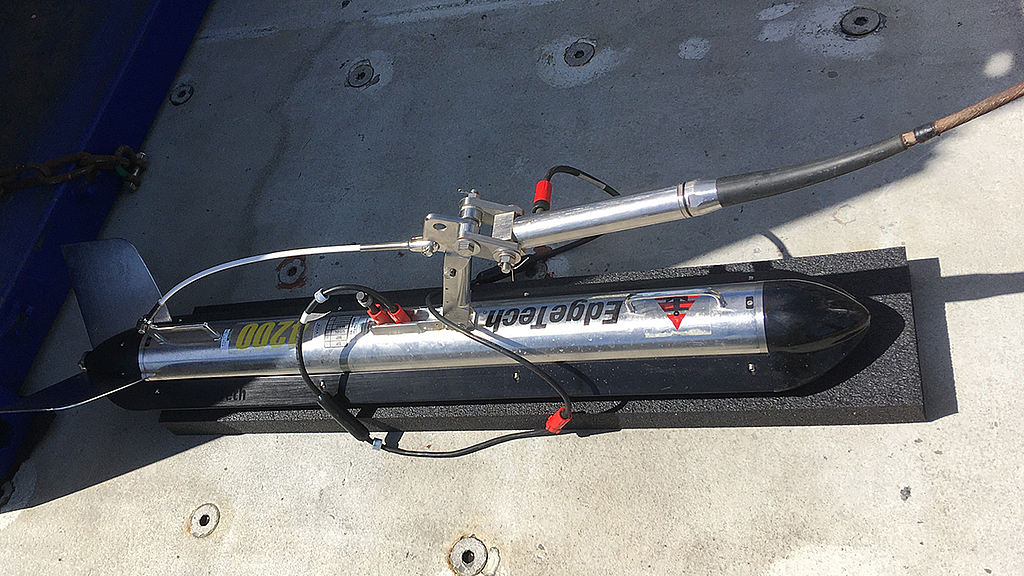
The side scan sonar instrument on deck of the research vessel RV Aurora © Katrine Juul Andresen, Aarhus University
The side scan sonar is dragged behind the ship at a height of 5-10 m above the seafloor. It emits sound waves on each side and measures the intensity of the reflected sounds waves. The intensity depends on the composition of the seafloor –a rugged seafloor will send back reflected waves with a high intensity. This way we get information about the lithology (description of the physical properties of a rock unit) – for instance whether there is sand or clay on the seafloor.
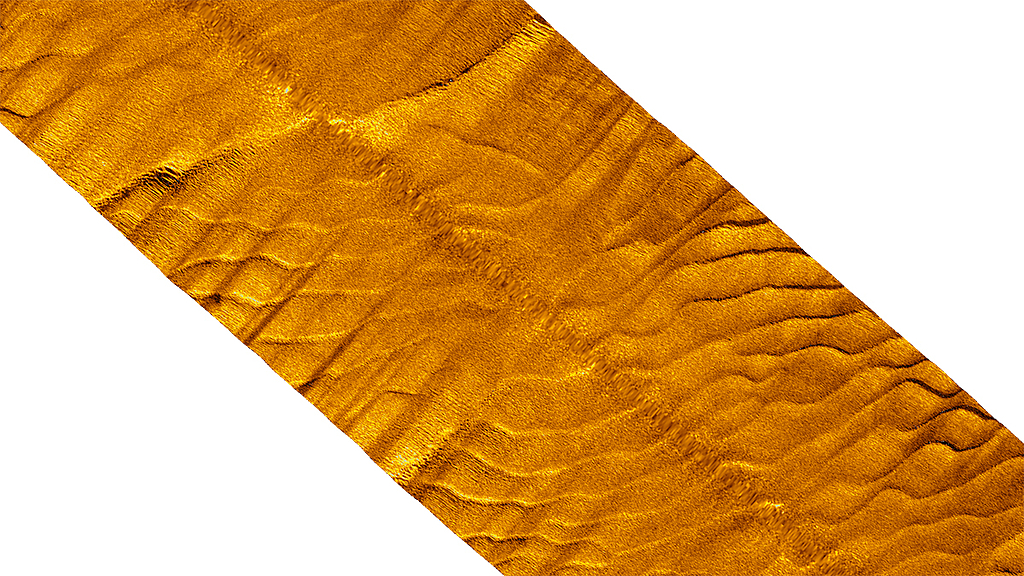
Side scan sonar data from the North Sea showing large sand dunes with smaller ripples superimposed © Katrine Juul Andresen, Aarhus University
The side scan sonar also gives us very detailed images of the wrecks - much like a photograph.
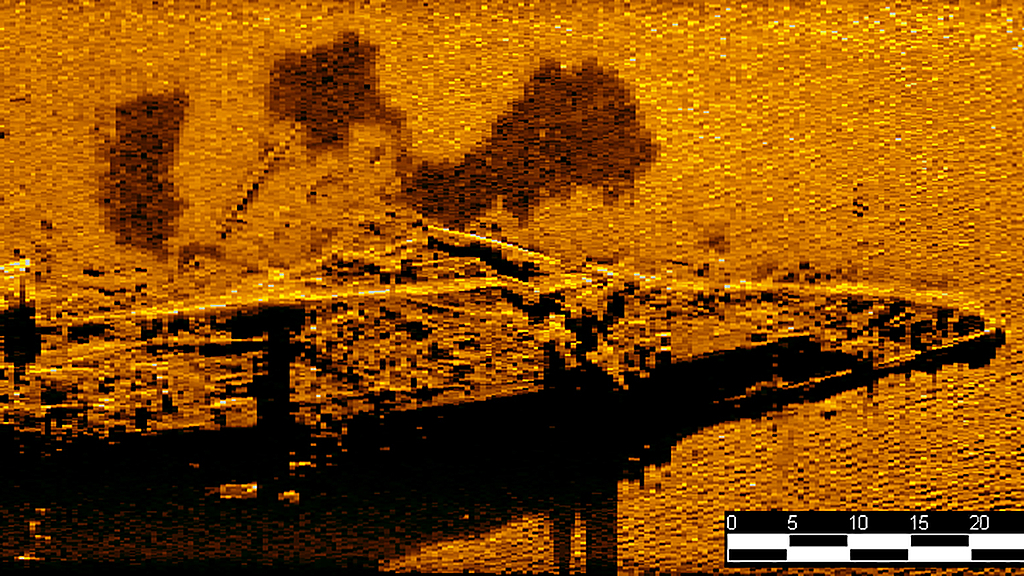
Side scan sonar data from the wreck of SMS Elbing showing many details of the wreck © Maria Hvidkjær Jensen, Aarhus University
The sub-bottom profiler is like a single beam echosounder and only emits one beam at a time. It is typically mounted on the hull of the ship and designed to ‘look’ below the seafloor. The sound waves emitted from the sub-bottom profiler is therefore of lower frequency and longer wavelength, which mean that they can travel longer and reach into the sediments below the seafloor. This instrument provides us with images or vertical profiles of the subsurface below the seafloor, where we can see how the sediment layers are distributed.

Sub-bottom profile showing a vertical cross-section at the SMS Elbing. The profile shows how sediment has been deposited around the wreck the last 100 years © Katrine Juul Andresen, Aarhus University
From this, we can learn about the geological development in the area of the wrecks and calculate, for instance, rates of sediment burial and sediment erosion around the wrecks.
Partner
-